Control Your Infrastructure Without Blind Spots
Ingest, parse, and query billions of log events with sub-second latency. Built for engineering teams that refuse to guess when things break.

Why Teams Switch to LogTrace
LogTrace replaces fragmented log stacks with a single pane of glass — purpose-built for high-throughput environments and compliance-heavy industries.
Sub-Second Query Latency
Full-text and structured queries return results in under 300ms across petabytes of indexed data. Our columnar engine, TraceDB, skips irrelevant partitions automatically so your team stops waiting and starts debugging.
AES-256 Encryption at Rest & in Transit
Every log event is encrypted before it leaves your agent and stays encrypted on disk. Key rotation, field-level masking, and SOC 2 Type II compliance are baked in — not bolted on.
Data Centers in Moscow and St. Petersburg
All data resides within Russian Federation borders. Dual-zone deployment across Yandex Cloud ensures 99.97% uptime and satisfies 152-FZ data sovereignty requirements out of the box.
Smart Alerting with Noise Reduction
Our anomaly engine correlates log spikes with infrastructure metrics to suppress false positives. Teams using LogTrace report a 73% drop in alert fatigue within the first 30 days.
30-Day Hot Retention, 12-Month Archive
Recent logs stay queryable in memory. Older events compress to cold storage at 1/10th the cost. You get full searchability without paying for data you only audit quarterly.
Native Integrations: Docker, Kubernetes, ELK Migration
Drop the LogTrace agent into any container or VM in under 60 seconds. One-click migration from Elasticsearch or Graylog preserves your dashboards and alert rules.
Trusted by Engineering Teams Across Russia
From fintech scale-ups to federal enterprises, LogTrace processes over 4.2 trillion log events per month with zero data loss.
4.2 Trillion Events / Month
Aggregate ingestion volume across all LogTrace tenants, peaking at 1.8 million events per second during Black Friday 2024.
99.97% Platform Uptime
Measured over the last 24 months. Our SLA credits have never exceeded 0.03% of monthly fees for any paying customer.
340+ Companies Onboarded
Including SberTech, Ozon Cloud, Tinkoff, Yandex, and 300+ mid-market teams in e-commerce, fintech, and logistics.
Mean Time to Detect: 47 Seconds
Across all monitored services, LogTrace customers identify incidents an average of 8.3× faster than teams relying on manual log scraping.
See LogTrace in Action
A live walkthrough of the dashboard — from agent deployment to your first alert rule in under five minutes.
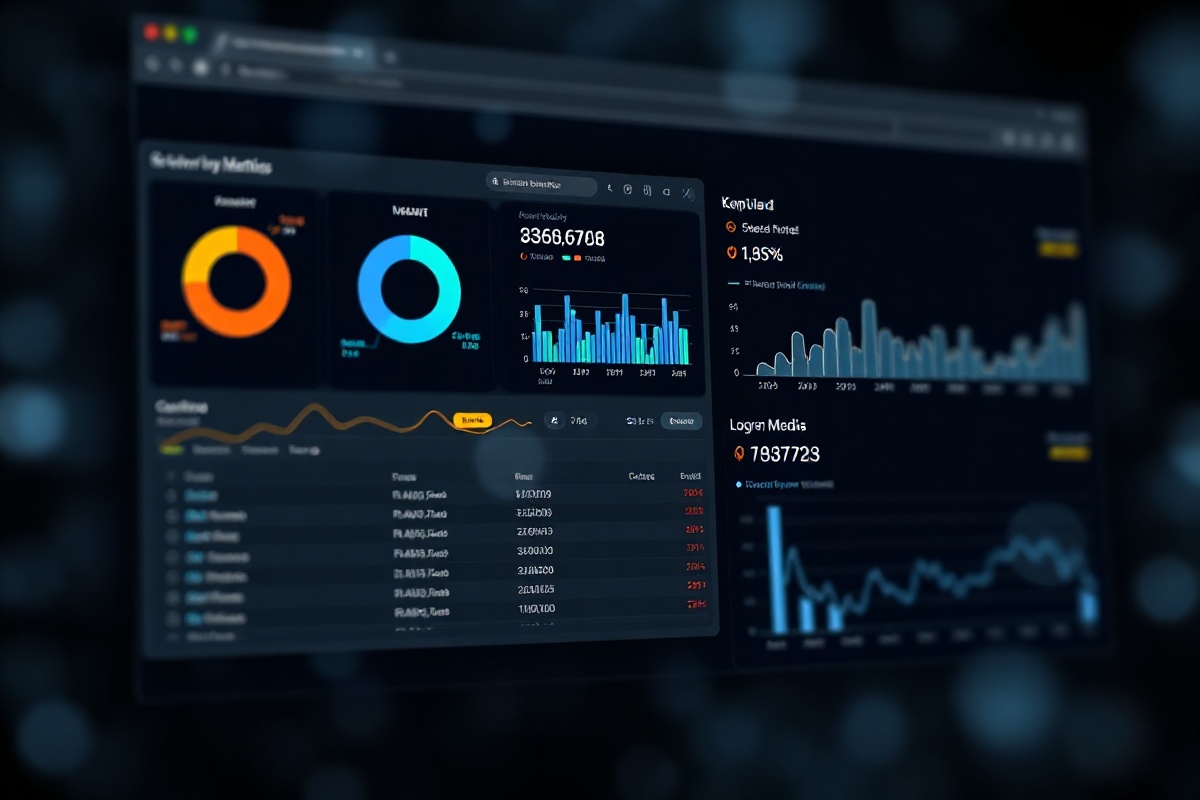
The interface is designed for speed: keyboard shortcuts for filters, drag-and-drop dashboard builder, and one-click log-to-trace correlation. No training required — if your team knows grep, they know LogTrace.
Integrations That Fit Your Stack
Connect LogTrace to the tools your team already uses. Native connectors ship preconfigured; custom pipelines take minutes to build.
Slack, Telegram & VictorOps
Route alerts to the channel your on-call engineer actually checks. Custom webhooks and JSON templates let you format every notification to your runbook standards.
Prometheus, Grafana & Zabbix
Enrich log events with metric context. LogTrace pushes correlated data back to your monitoring stack so you never lose the signal-to-noise ratio.
Jira & YouTrack
Auto-create tickets from recurring error patterns. Each ticket includes the exact log snippet, stack trace, and affected service — reducing handoff time by 60%.
Simple, Transparent Pricing
Pay for what you ingest. No hidden fees, no egress charges, no surprise invoices.
Starter — Free
Up to 500 MB/day ingestion, 7-day retention, 2 team members. Perfect for evaluating LogTrace on a single microservice or staging environment.
Pro — от 18 000 ₽/мес
Up to 50 GB/day ingestion, 30-day hot retention, unlimited team members, alerting, and SLA support. The plan chosen by 78% of our customers.
Enterprise — Custom
Unlimited ingestion, 12-month archive, dedicated support engineer, on-premise agent deployment, and custom compliance reports. Volume discounts applied automatically.
Stop Guessing. Start Knowing.
Deploy the LogTrace agent today and see your first log events in the dashboard within 90 seconds. No credit card, no commitment, no infrastructure changes required.
Join 340+ engineering teams who replaced fragmented log pipelines with a single, observable truth. If your team is still tailing files at 2 AM, LogTrace was built for you.
Start Free — 14 Days, No Card Talk to SalesControl Your Infrastructure Without Blind Spots
Ingest, parse, and query billions of log events with sub-second latency. Built for engineering teams that refuse to guess when things break.
Why Teams Switch to LogTrace
LogTrace replaces fragmented log stacks with a single pane of glass — purpose-built for high-throughput environments and compliance-heavy industries.
Sub-Second Query Latency
Full-text and structured queries return results in under 300ms across petabytes of indexed data. Our columnar engine, TraceDB, skips irrelevant partitions automatically so your team stops waiting and starts debugging.
AES-256 Encryption at Rest & in Transit
Every log event is encrypted before it leaves your agent and stays encrypted on disk. Key rotation, field-level masking, and SOC 2 Type II compliance are baked in — not bolted on.
Data Centers in Moscow and St. Petersburg
All data resides within Russian Federation borders. Dual-zone deployment across Yandex Cloud ensures 99.97% uptime and satisfies 152-FZ data sovereignty requirements out of the box.
Smart Alerting with Noise Reduction
Our anomaly engine correlates log spikes with infrastructure metrics to suppress false positives. Teams using LogTrace report a 73% drop in alert fatigue within the first 30 days.
30-Day Hot Retention, 12-Month Archive
Recent logs stay queryable in memory. Older events compress to cold storage at 1/10th the cost. You get full searchability without paying for data you only audit quarterly.
Native Integrations: Docker, Kubernetes, ELK Migration
Drop the LogTrace agent into any container or VM in under 60 seconds. One-click migration from Elasticsearch or Graylog preserves your dashboards and alert rules.
Trusted by Engineering Teams Across Russia
From fintech scale-ups to federal enterprises, LogTrace processes over 4.2 trillion log events per month with zero data loss.
4.2 Trillion Events / Month
Aggregate ingestion volume across all LogTrace tenants, peaking at 1.8 million events per second during Black Friday 2024.
99.97% Platform Uptime
Measured over the last 24 months. Our SLA credits have never exceeded 0.03% of monthly fees for any paying customer.
340+ Companies Onboarded
Including SberTech, Ozon Cloud, Tinkoff, Yandex, and 300+ mid-market teams in e-commerce, fintech, and logistics.
Mean Time to Detect: 47 Seconds
Across all monitored services, LogTrace customers identify incidents an average of 8.3× faster than teams relying on manual log scraping.
See LogTrace in Action
A live walkthrough of the dashboard — from agent deployment to your first alert rule in under five minutes.
The interface is designed for speed: keyboard shortcuts for filters, drag-and-drop dashboard builder, and one-click log-to-trace correlation. No training required — if your team knows grep, they know LogTrace.
Integrations That Fit Your Stack
Connect LogTrace to the tools your team already uses. Native connectors ship preconfigured; custom pipelines take minutes to build.
Slack, Telegram & VictorOps
Route alerts to the channel your on-call engineer actually checks. Custom webhooks and JSON templates let you format every notification to your runbook standards.
Prometheus, Grafana & Zabbix
Enrich log events with metric context. LogTrace pushes correlated data back to your monitoring stack so you never lose the signal-to-noise ratio.
Jira & YouTrack
Auto-create tickets from recurring error patterns. Each ticket includes the exact log snippet, stack trace, and affected service — reducing handoff time by 60%.
Simple, Transparent Pricing
Pay for what you ingest. No hidden fees, no egress charges, no surprise invoices.
Starter — Free
Up to 500 MB/day ingestion, 7-day retention, 2 team members. Perfect for evaluating LogTrace on a single microservice or staging environment.
Pro — from ₽18,000/mo
Up to 50 GB/day ingestion, 30-day hot retention, unlimited team members, alerting, and SLA support. The plan chosen by 78% of our customers.
Enterprise — Custom
Unlimited ingestion, 12-month archive, dedicated support engineer, on-premise agent deployment, and custom compliance reports. Volume discounts applied automatically.
Stop Guessing. Start Knowing.
Deploy the LogTrace agent today and see your first log events in the dashboard within 90 seconds. No credit card, no commitment, no infrastructure changes required.
Join 340+ engineering teams who replaced fragmented log pipelines with a single, observable truth. If your team is still tailing files at 2 AM, LogTrace was built for you.
Start Free — 14 Days, No Card Talk to Sales